Known Unkowns:What do we know about the performance of bonds and stocks over the next 12 months?
This is a question that I have seen or heard several times in the last few weeks:
Given the current state of the markets, are bonds or equities likely to do better over the next 12 - 24 months given that both have seen significant drops over the past 12 months?
Now I am not in the business of making predictions, and of course it is impossible to answer this question without a crystal ball. More importantly, the answer is irrelevant because the golden rule in this particular contest is to stick with a well-diversified portfolio that has been designed to meet your goals by your financial advisor.
So if you want a definitive answer to the above question you can stop reading now. But there is some evidence we can use to see how stocks and bonds may play out from here.
The question as stated is one of making a prediction based on “unknown unknowns” – we don’t know what will happen in the next 12 month or how that will impact the performance of stocks and bonds. However, there are “known unknowns” that help frame the problem. What information do we have to help us look forward on bond and stock returns?
Have bonds bottomed out?
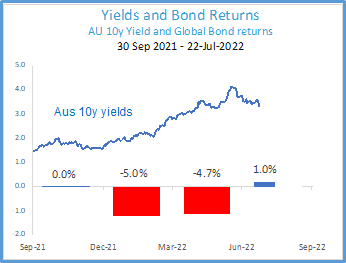
Let’s start with bonds. It has been the worst start to the year in bonds since the 1940’s, and the last time we saw a negative annual return from bonds was back in 1994.
However, when we look at a plot of yields and quarter by quarter bond returns we can see that yields have reached an apex and starting to come down.
Note that it is bond yields that affect bond prices, not interest rates (i.e.overnight cash rates which the RBA control). Yields are forward looking and rise in expectation of future interest rates and expectations around inflation and the economy in general.
The fall in yields (and hence rise in bond prices) towards the end of June and into the first weeks of July tells us two things:
- First, this is an indication that the market has priced in future cash rate increase, but if cash rate were to be realised it would have a significant impact on households’ ability to service their mortgages, particularly amid rising living costs caused by inflation. As a result, it will be difficult for the RBA to increase the cash rate beyond current market expectations, which should limit Australian bond yields from rising much further.
- Secondly, the expectations around a future recession also create more uncertainty in the equity world. This leads to a move back into bonds as they are seen as a safe-haven asset, are unlikely to suffer further capital losses, and are now yielding close to 4 percent yield to maturity.
In short, bonds should provide a positive return going forward.
What is the story with stocks?
Predicting the short term path of equities is impossible as we don’t have the same forward looking relationship between yields and prices. But we do know something about market downturns.
Market downturns are always unsettling, but we do have nearly 100 years of data on the US stock market to help us look at market returns after a downturn. As the chart below shows, over the past century US stocks have averaged positive returns over one-year, three-year, and five-year periods following a steep decline.
A year after the S&P 500 crossed into bear market territory (a 20% fall from the market’s previous peak), it rebounded by about 20% on average. And after five years, the S&P 500 averaged returns over 70%. So we cannot say whether stocks have bottomed out or whether there is more volatility to come, but we do know that on average markets recover very quickly from a downturn.
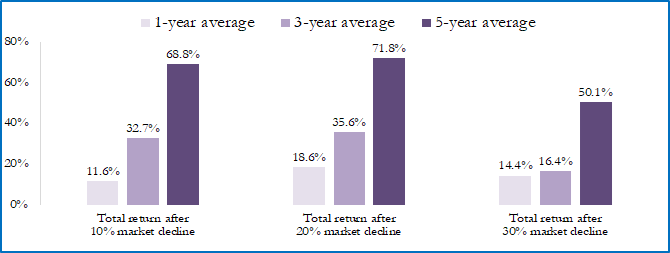
Fama/French Total US Market Research Index returns, July 1, 1926–December 31, 2020
Won’t a recession be bad for stocks?
Are we headed into a recession? That is a possible outcome from the current path of cash rate increases. As mentioned earlier, there are signs of a flight back to quality bonds for this very reason. But does that mean that stocks will continue to fall?
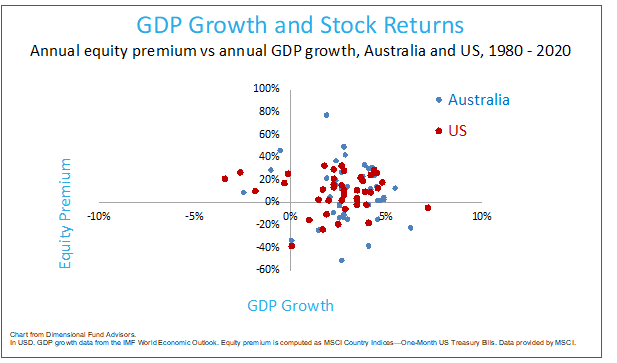
One of the best predictors of the economy is the stock market itself. Markets tend to fall in advance of recessions and start climbing earlier than the economy does.
In the chart below we show the annual return of stocks sown as an equity premium, which is the return of the market minus bills) in Australia and the US against annual GDP growth. The dots in the lower right quadrant show where GDP growth has been negative, but the return on stocks has been positive. In fact, in this data set (from 1980) there has not been a period where GDP growth was negative and stocks were also negative (lower left quadrant).
So even if we know for sure the economy is heading for recession (and we don’t know that for sure) it does not mean stocks will be negative in the negative growth period. The stocks have already worn the pain of a coming recession before the recession arrives.
What else do we know about the behaviour of bonds and stocks?
We do know that over the long run bonds and stocks are modestly correlated – in other words, most times both asset classes have positive returns on an annual basis. Stocks have negative annual returns on average every 4 years, while it is less common for bonds to have an annual negative return.
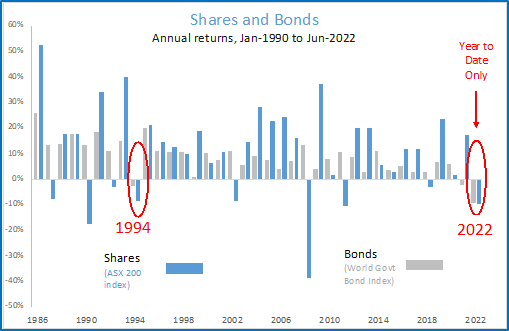
Typically, bonds play the support role most evidently when stocks have negative years. It is rare when both stocks and bonds are both negative – but it has happened before, as shown in the above chart. And keep in mind that we are only halfway through 2022, so a lot can happen in the next 6 months.
Typically, when bonds or stocks have had a negative annual return they bounce back strongly in the next 12 months.
Conclusion
We cannot definitively answer the question as to who will win between stocks and bonds over the next 12 – 24 months. We have shown here that bonds may well have finished their cycle and may now return 3% - 4%. Of course, yields can still go up or down, but one is not expecting the drastic shifts in yields we have seen in the first 6 months of this year.
We do not know what equities will do in the short term, but we have shown that equities recover from market downturns quickly. There is much media speculation that we (or the US) are heading into a recession, but we have shown here this does not mean that equities will have a negative return if there is an economic recession.
We believe that staying invested in the portfolio that has been designed for you by your advisor puts you in the best position to capture the recovery. If you change your portfolio by shifting the asset allocation from equities to bonds (or vice versa), it should be a strategic, not tactical, choice. The only good reason to change your portfolio now is because you learned something about your risk tolerance, or your investment goals have changed.
General Advice Warning
Any advice or information in this publication is of a general nature only and has not taken into account your personal objectives, financial situation and needs. Because of that, before acting on the advice, you should consider its appropriateness to you, having regard to your personal objectives, financial situation and needs.
Before making a decision to acquire a financial product, you should obtain and read the Product Disclosure Statement (PDS) relating to that product, it is important for you to consider these matters and to seek appropriate advice. Past performance is not a reliable guide to future returns. The information in this document reflects our understanding of existing legislation, proposed legislation, rulings etc as at the date of issue. In some cases, the information has been provided to us by third parties. While it is believed the information is accurate and reliable, this is not guaranteed in any way. Opinions constitute our judgement at the time of issue and are subject to change. Neither we nor our employees give any warranty of accuracy, nor accept any responsibility for errors or omissions in this document.
Identity McIntyre Pty Ltd (ASIC No 461171) is a corporate authorised representative of IMFG Pty Limited, Australian Financial Services Licensee number 527657 Registered Office at: Level 8, 171 Clarence Street, Sydney NSW 2000.

Identity McIntyre Pty Ltd (ASIC No 461171) is a corporate authorised representative of IMFG Pty Limited, Australian Financial Services Licensee number 527657 Registered Office at: Level 8, 171 Clarence Street, Sydney NSW 2000.
General Advice Warning - Any advice on this site is general nature only and has not been tailored to your personal objectives, financial situation and needs. Please seek personal advice prior to acting on this information. Any advice on this website has been prepared without taking account of your objectives, financial situation or needs. Because of that, before acting on the advice, you should consider its appropriateness to you, having regard to your objectives, financial situation or needs.
E. info@imfg.com.au
P. (+61) 2 9002 0570
OFFICE: Level 8 - 171 Clarence Street
Sydney NSW 2000