What does a change of government mean for the stock market?
The Australian Election held on May 21st generated lots of views and news, but one thing that is rarely talked about is what effect elections have on financial markets? And this may surprise many people, but the reason that it's not normally part of the election debate is that, well, elections don’t actually have any impact on the stock market!
This is not necessarily because financial markets don’t take elections into account. But the truth is that elections are just one of many factors that drive the prices of securities. And it is very hard to separate any one of those myriad factors from the others.
The issues that move financial markets have more to do with rising measures of consumer price inflation, the removal of emergency policy stimulus by central banks and Russia’s invasion of Ukraine.
Of course, it is in the interests of politicians of either side to claim they ‘manage’ the economy and talk up the dire consequences of what would happen if their opponents took power. But markets to date have not been showing any disquiet either way.
There is very little evidence from history either that election wins from one major party or the other has a definitive impact on the local share market, separate from all the other things going on at the time of the election.
The chart below shows the frequency of monthly returns of a broad-based Australian equity benchmark in the months when Australia elections were held over the past 50 years, going back to the election of the Whitlam government in 1972.
The red marks represent the months the Australian Labor Party won. The blue marks represent months the Liberal-National Coalition won. The grey marks represent non-election months over this half-century period. Dashes representing returns of a given month are stacked in ascending order of return within each column, with the highest return within that range on top.
In this time, there were 19 Australian federal elections, of which 10 were won by the Coalition and nine by Labor. The chart shows election month returns have been well dispersed throughout the range of outcomes, with no clear pattern based on which party won.
For instance, the single worst result in this sample was the election held in May 1974, won by Labor under Gough Whitlam and a month in which the local share market fell more than 14%. But then the single best result was also an election won by Labor under Bob Hawke in July 1987, when the market rose by more than 14%.
Of course, other things were also happening in both those years. From 1973-74, for instance, global equity markets were suffering one of their worst downturns following the collapse of the Bretton Woods system of fixed currencies and a global oil shock.
Figure 1: Distribution of Monthly Returns
MSCI Australia Index, January 1970 – April 2022
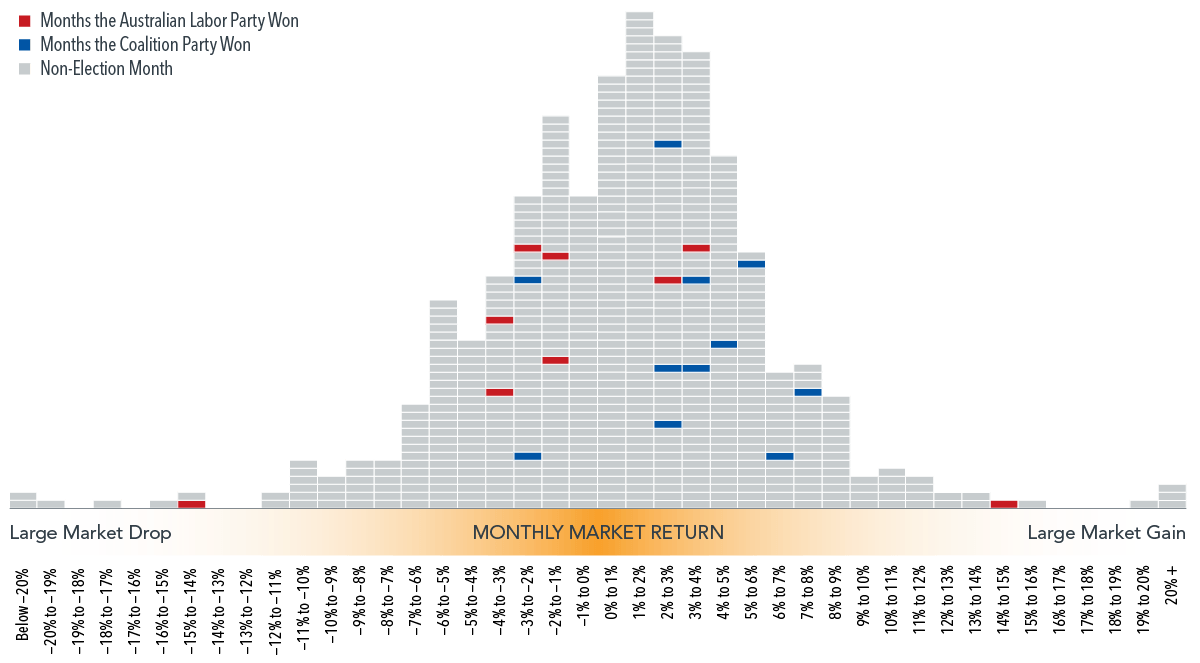
Chart from Dimensional Fund Advisors, April 2022
In 1987, global share markets were coming to the end of a five-year bull run that ended in October that year with the so-called Black Monday crash.
The point is that at any one time, there is news coming from many different directions – from company earnings to economic data to geopolitical events to policy and regulatory changes.
It is natural for investors to look for a connection between who wins power in Canberra and which way stocks will go. But shareholders are investing in a company, not a political party. And companies focus on serving their customers and helping their businesses grow, regardless of who is in government.
This means that making investment decisions based on the predictions of election outcomes or actual outcomes is unlikely to result in reliable excess returns. On the contrary, it may lead to costly mistakes.
Ultimately, this adds up to a strong case for relying on a consistent approach to your asset allocation—making a long-term plan and sticking to it.
General Advice Warning
Any advice or information in this publication is of a general nature only and has not taken into account your personal objectives, financial situation and needs. Because of that, before acting on the advice, you should consider its appropriateness to you, having regard to your personal objectives, financial situation and needs.
Before making a decision to acquire a financial product, you should obtain and read the Product Disclosure Statement (PDS) relating to that product, it is important for you to consider these matters and to seek appropriate advice. Past performance is not a reliable guide to future returns. The information in this document reflects our understanding of existing legislation, proposed legislation, rulings etc as at the date of issue. In some cases, the information has been provided to us by third parties. While it is believed the information is accurate and reliable, this is not guaranteed in any way. Opinions constitute our judgement at the time of issue and are subject to change. Neither we nor our employees give any warranty of accuracy, nor accept any responsibility for errors or omissions in this document.
Identity McIntyre Pty Ltd (ASIC No 461171) is a corporate authorised representative of IMFG Pty Limited, Australian Financial Services Licensee number 527657 Registered Office at: Level 8, 171 Clarence Street, Sydney NSW 2000.